Your book, at last, tells you where it fails.
You publish a book and win or lose schools without knowing why. MathCracks turns every hand-written exercise into data: we tell you which unit is hardest to learn, on which page, and whose fault it is — the book's, the school's, the class's or the student's.
Real student data from schools that use your books.
The thesis
Is it the book, or the classroom?
We separate blame by level. It's the question no publisher has been able to answer with data — until now.
The book
The lesson design: explanation, examples, sequence, prerequisites. What repeats across every school.
The school
The centre: its project, its pace, its context. It varies between schools; it doesn't travel with the book.
The class
The group and the teacher. If the problem lives in one classroom, a new edition won't fix it.
The student
Each student's starting point. We discount it so it doesn't blur the diagnosis.
If a lesson fails in a single class, it isn't the book: it's that class.
If it fails in every school, it's the book.
We discount student and school with a hierarchical model and measure the effect only the book explains. Every figure carries its confidence interval and sample size.
What we do
Far more than grading
We grade and create exams, set up classes and guide the student. But what's unique is what we do with the data.
Living index of the book
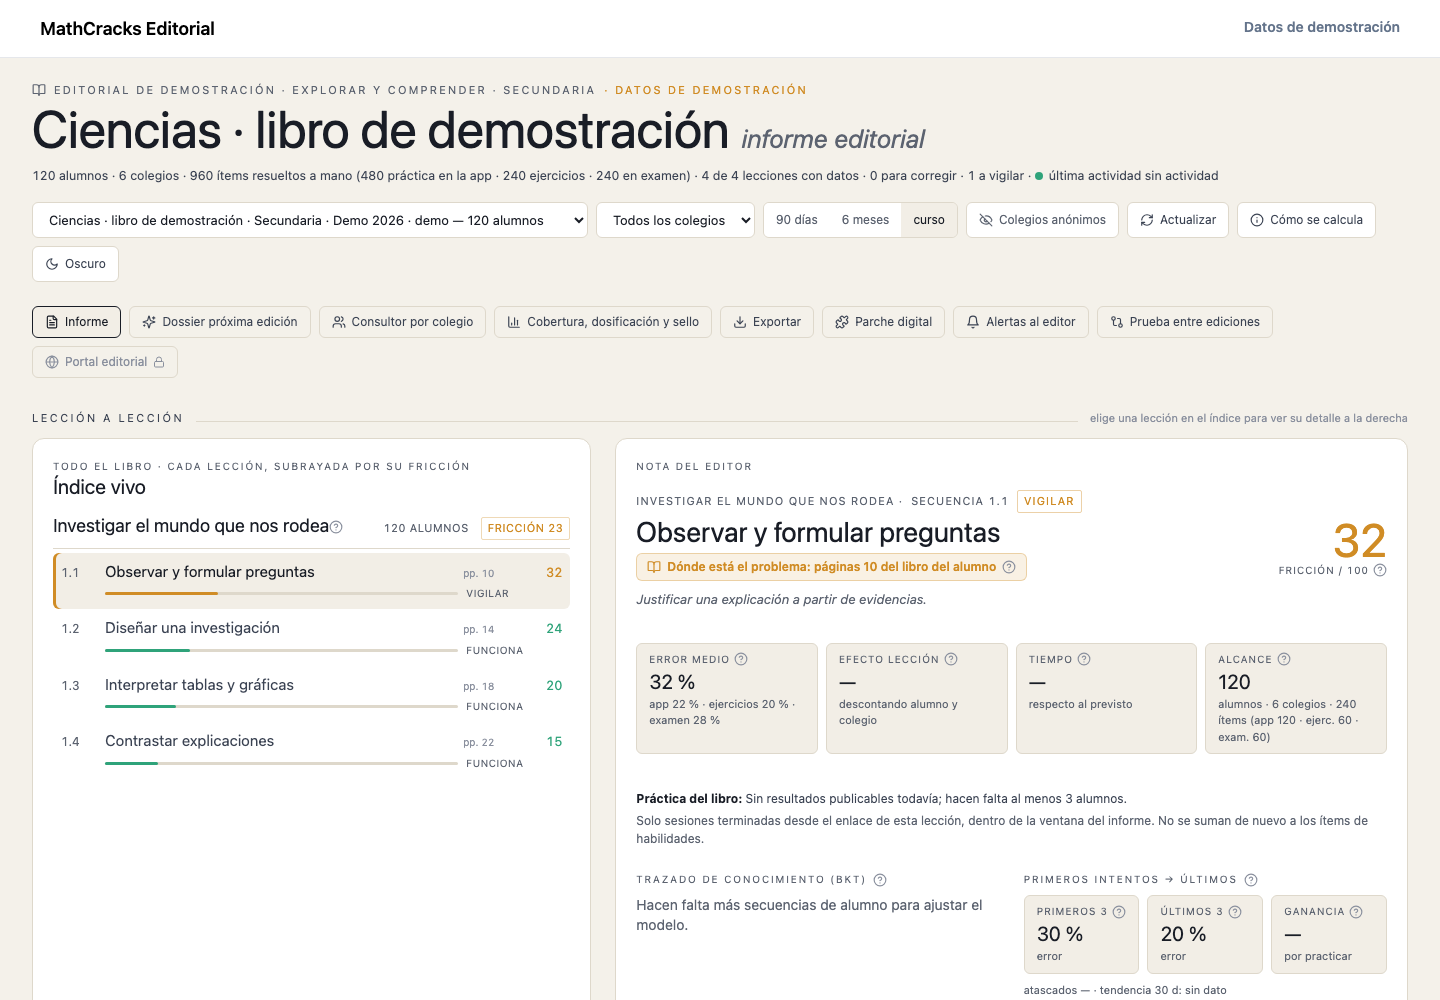
Your usual index, unit by unit, with a friction score telling you how hard each lesson is to learn.
Book or classroom?
Each lesson placed between 'it's the book' and 'it's the class' — depending on whether it fails the same everywhere or only in some classes.
What to improve in the next edition
A ranking of lessons to redesign by impact, with the exact page and an editorial recommendation written by AI.
River of comprehension
How students move, unit by unit, between mastering, progressing and getting stuck.
Proof of improvement, edition to edition
Did the friction drop where you changed things? We compare editions and cohorts and prove it.
Handwriting, not clicks
The data comes from what the student writes by hand, exercise by exercise: no one else has it.
Metrics that didn't exist
The book's language, measured
New figures, built for whoever decides what gets fixed in the next edition.
Book-fault index
How much of the error is explained by the book's design and not by the student, school or class.
Cross-school consistency
If the failure repeats across very different schools, it's a book signal, not context.
Reproducibility
'17 of 19 schools reproduce this error peak': the verdict that holds up before your data team.
Cost of page X
Student-hours lost and children stuck on a lesson: the real price of an editorial mistake.
Data with purpose
One dataset, for whoever decides
MathCracks is an educational data company. The same evidence works, at every level, to find the problem.
Publishers
Where your book fails, on which page and why — for the next edition and to retain schools.
Schools
Whether the problem is the student, the class or the book — and what to re-teach tomorrow.
Governments
Where the system fails by region, year and subject — to steer support where it's really needed.
Families
What their child struggles with, concretely, and how they improve week by week.
How it works
From the page to the verdict
The book is practised
Students solve your units' exercises by hand; OCR reads and grades them.
Unit → skill is mapped
Each lesson in your book is linked to the skills it measures, with its page.
Discount and decide
The model discounts student and school and isolates the book's effect, with interval and sample.
The report is delivered
A monthly editorial bulletin with the verdict, the redesign ranking and the proof of improvement.
The deliverable
The editorial bulletin
Every month or every edition, a report your team can take to the product meeting — and the sales one.
- Executive verdict: what is the book's and what is the classroom's.
- Top-10 lessons to redesign, by impact and effort.
- A card for each red lesson, with the exact page and the typical error.
- Proof of improvement: new edition versus the previous one.
- Method and privacy annex: aggregated, pseudonymised, with sample minimums.
Publishers by country
The same engine, with each market's curriculum and publishers.
Teach your book to speak.
We start with one of your series in a pilot of schools. In the first month you'll already see where it fails.
Write to us · [email protected]Student data stays with the school; the publisher receives the aggregate by unit and skill.